Grapt
In Plotting Points, I ranted about how it‘s difficult to take a column of data and turn it into something visual without resorting to non-CLI tools. Well, with grapt, I may have done something about it, or at least started on something that could be a reasonable solution.
If you recall, the problem statement was something along the lines of “Why can’t I tack on | linegraph to get a nice DWIM graph?”
Grapt allows me to easily do this:
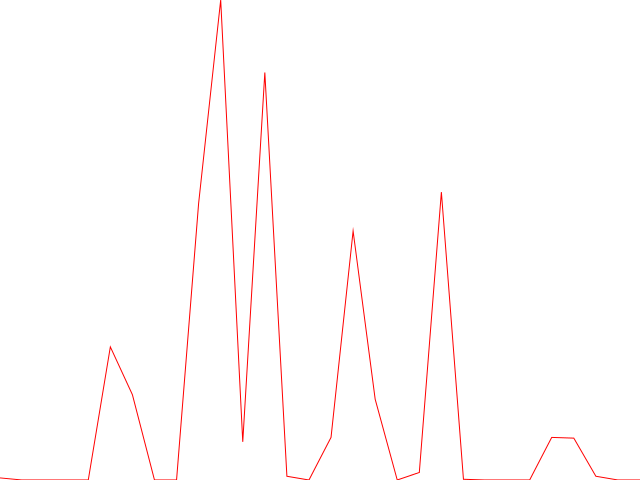
$ iostat 1 30 | grep 'sda' | awk '{print $2}' | grapt -o iops.png
which gives me:

There‘s no padding. No scale. No features. It just reads in a column (or 2) of data and draws a graph. I do however plan on adding a few features when I get around to it (or need them):
- Padding around the viewing window. Even a few pixels would help here.
- Multiple series on the same chart, ideally with independent scales,
if I can DWIM it well enough. I don’t really want to build out labels, and tick marks and that type of stuff, but we‘ll see. 3. Multiple series will likely imply a need for specifying colors in an appropriate way. My guess is that this will be doable by reading an environment variable GRAPT_COLORS which would then just be a comma separated list of RGB triplets in hexidecimal. 4. Smoothing. Likely just a moving average smoother for simplicity’s sake. 5. Support for distributions of some kind. Bonus points if I can support something truly neat like frequency trails easily.
These things probably won‘t be added until I need them, as the basic usage fits most of my graphing needs when using the CLI, but only time will tell.
—2017-01-01